

From Beginning

Unlock the full potential of Microsoft Excel with our Advanced Excel Training Course in Ahmedabad. Designed for professionals and students alike, this course goes beyond basic spreadsheets, equipping you with the skills to manage, analyze, and visualize complex data effectively.
Whether you're handling business reports, financial models, or operational data, mastering Excel's advanced features can give you a serious edge in your career:
Level up your Excel skills and supercharge your professional value with our Advanced Excel Course in Ahmedabad. Whether you're preparing for a data-driven role or looking to enhance workplace efficiency, this course provides everything you need to excel.
Exercise: Create a new Excel workbook and explore the interface.
| Formula | Description | Example | | --- | --- | --- | | =A1+B1 | Addition | =2+3 | | =A1-B1 | Subtraction | =5-2 | | =A1*B1 | Multiplication | =4*5 | | =A1/B1 | Division | =10/2 |
Exercise: Practice basic arithmetic operations using the formulas above.
| Function | Description | Example | | --- | --- | --- | | SUM(A1:A5) | Sum of a range | =SUM(1,2,3,4,5) | | AVERAGE(A1:A5) | Average of a range | =AVERAGE(1,2,3,4,5) | | COUNT(A1:A5) | Count of cells in a range | =COUNT(1,2,3,4,5) |
Exercise: Practice using basic functions.
Exercise: Enter and edit data in a sample dataset.
| Format | Description | Example | | --- | --- | --- | | Number | Display numbers with decimal places | 1234.56 | | Currency | Display numbers with currency symbols | $1234.56 | | Date | Display dates in a specific format | 02/14/2023 |
Exercise: Practice formatting data using different formats.
Exercise: Create a data validation rule to restrict data entry.
Exercise: Practice using conditional formatting to highlight cells.
Exercise: Practice filtering and sorting a sample dataset.
Exercise: Create a PivotTable to analyze a sample dataset.
Exercise: Practice using the INDEX and MATCH functions.
Exercise: Practice using the VLOOKUP function.
Exercise: Record a macro to automate a task.
Exercise: Practice using the Regression tool.
Exercise: Practice using the Trendline feature
Exercise: Practice creating a dashboard using multiple charts.
Yes, Sure. You can attend a Free Demo Lecture.
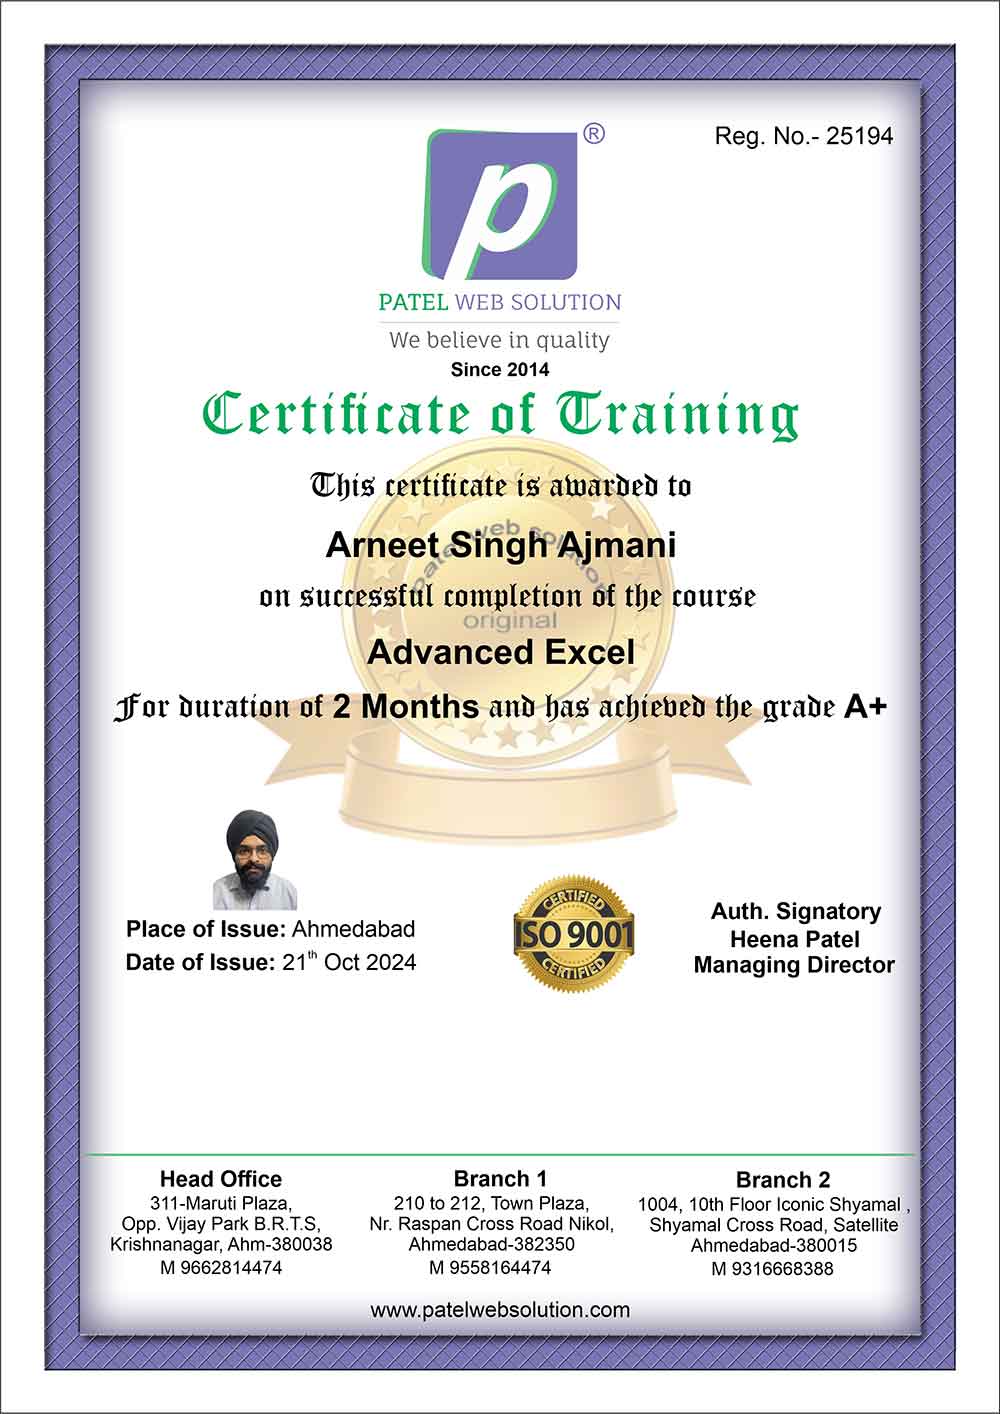
Yes, We will Provide ISO 9001:2015, Government Approved Certificate.
Yes, you Can Pay your Fees in EMI options.
Yes, you will get a good Discount in One Short Payment Option.
Yes,our 50% students are from Non IT Background.
Yes, 100%. We have our own Job Placement Consultancy – My Job Placement.
Yes, we are providing FREE Spoken English Sessions, Interview Preparation & Mock Round for Interviews.
Yes Sure, We arrange Our Batches according College Students & Working Professionals.
As per our standard Rules, We have decided a fix duration for every courses. But if any student requires a few more time then no problem.
Yes, We are providing 15/45 Days Internship & 3 to 12 Months Internship also we are providing with Live Project Training & Job Placement.
Advanced Excel involves using Excel's powerful tools and features such as PivotTables, advanced formulas, macros, data visualization, and automation for handling complex datasets and performing in-depth analysis.
PivotTables summarize and analyze large datasets by grouping, sorting, and filtering. They are useful for creating dynamic reports and gaining insights from data without using complex formulas.
Conditional formatting allows you to apply styles or highlights to cells based on certain conditions.
Power Query is a tool for extracting, cleaning, and transforming data from various sources.
Example: Import and clean data from a CSV file using Power Query.
Solver is used for optimization problems, where it helps find the best solution by changing variables within given constraints. Example: Minimize costs while maximizing production under resource limitations.

Flexible supported learning



Flexible supported learning





Apart from technical training in various Website Development, Application Development & Software Development , Patel Web Solution helps you get a foothold I booming IT Industry. 100% Placement Assistance a student completes his / her course successfully. Patel Web Solution Dedicated Placement Cell helps him/her interview with major companies in job roles like programmer, web developer, software tester, database analyst & many more.


Land your dream job at one of the leading tech companies














We believe in quality

Patel web solution exceeded my
expectations with their
comprehensive Power Bi course.
Every aspect was covered in
detail. Patel Web Solution are
highly knowledgeable and
approachable, always ready to
provide guidance and support.
My trainers are motivating and
inspiring me to move forward
for every step. I'm on the way to
my "developer" career. Thanks
for the supportive service. I'll
surely suggest PWS to all my
friends.
Master of Computer Application (MCA) - RB Institute of Management Studies

I'm Dhruvi Parekh. I enrolled in
Web Development Course here.
It was really really good
experience and learned a lots of
new things here, faculty was also
good and friendly too. Overall it
was really nice here in Patel
Web Solutions and I would
really recommend to visit here
Diploma in Computer Engineering. - Monark University

I took a Full Stack Development
programming course at Patel
Web Solution, and it was
fantastic. The instructor was
very clear and thorough,
explaining complex concepts in
simple terms. The course had a
lot of practical exercises, which
helped me build a strong
understanding of the language.
The institute offered great
support, including career
counseling and resume-building
workshops. I now feel confident
in applying for Full Stack
Development roles, and I have
already landed my first job with
the help of job placement done
by Patel Web Solution.
Bachelor of Computer Application(BCA) - Monark University

My name is Radhika Borad. I
have learn coreldraw softwere
here. My experience was
amazing, this course gave me a
head start to my career. I got
access to an amazing community
where people uplift each other
and grow together. It is carefully
curated to help you throughout
your journey. It's a once in a
lifetime experience and I'll
forever be grateful. And I also
get my job placement Support so
I suggest to all please must visit
Patel Web Solution.
Bachelor of Computer Application (BCA) - KSN kansagara Mahila College, Rajkot

I am so grateful and thankful to
Heena Maam & Manushree
Maam for helping me to learn
Adobe Illustrator in very efficient
way . You guide me so well
thank you for giving me this
opportunity in IT field I have got
placement in a very good
company from Patel Web
Solution and I am very happy
with my job and in future I can
make my career in this job.
Thanks a lot to PWS and my
trainers for the continuous
support and concern.
Diploma in Computer Engineering - Apollo Institute of Engineering and
Technology

Learning from Patel Web
Solution has transformed my
skills to a big extent. When I
joined C,C++ & Web Design
course, I had zero skills. But
now I am happy that I am
knowledgeable to develop
innovative websites. Thanks to
the entire team of Patel Web
Solution for their constant
support.I really appreciate
Bachelors in Vocational in Information and
Bachelor of Commerce(B.com) - JG University

Hello my name is Priyanka
Mangroliya. I recently
completed React Native Course
at Patel Web Solution. I had
best experience during my
training. The trainer is really
good and explained me with
many real-time examples. The
institution has very good in
infrastructure and also good for
studying. I will surely
recommend this institute if u
want to improve your personal
skills and knowledge.
Bachelors in Vocational in Information and
Bachelor of Commerce(B.com) - R.K Vaghasiya Commerce College

I have completed Ui/Ux Course
here. Institute is a top-notch
service that offers affordable and
high-quality education. The
institute provides support and
guidance, and offers career
insights and portfolio
preparation sessions class and
environment. They teach like
real life experience and things.
My confidence and my
personality totally changed. One
best thing is Free interview skills
for all..so guys please visit Patel
Web Solution for making your
future brighter with learning best
Industry level Courses.
Bachelors in Vocational in Information and
achelor of Commerce(B.com) - Shree Sahjanand Arts & Commerce
College

Completing Web Development
with Patel Web Solution was a
wonderful experience. Under
their guidance, I delved into
various aspects of web
development, from HTML and
CSS to JavaScript and beyond.
The hands-on projects allowed
me to apply theoretical
knowledge to real-world
scenarios, honing my skills and
boosting my confidence. A good
place to grow and build a
network.
Bachelors in Vocational in Information and
Technology (MCA) - Silver Oak University

I highly recommend Patel Web
Solution for their comprehensive
IT courses. Their React
JS course covered everything
from HTML to Bootstrap and
beyond. The teaching was
excellent, and I gained valuable
industry-related experience. The
interview preparation classes
were also incredibly helpful. If
you're looking for a reliable
place to learn IT skills, Patel
Web Solution is the way to go!
Master of Computer Application (MCA) - RB Institute of Management Studies

I just completed my internship
in Web Design Course with
Python(django). Gain the
industry level knowledge. An
enriching experience with top-
tier faculty and excellent
learning resources. The campus
is welcoming, and the
opportunities for growth are
endless.Overall a very
informative training session.
Course content got well
covered and also demonstrated
the concept very well. Thanks
for such an informative and
concept-clearing training
session.
B-tech - Indus University

Patel Web Solution is a Best
Company for IT training. I
learnt C,C++, Web Design, Php
& WordPress. The professors
are experts in their fields and are
always available to help
students. The curriculum is
rigorous but engaging, and the
hands-on learning opportunities,
such as internships and projects,
have been invaluable. The
campus is beautiful, with
modern facilities and plenty of
study spaces. I feel prepared for
my career, and I highly
recommend this institute to
anyone looking for a quality
education.
12th Commerce - Jai Hind Vidhyalaya

I chose Flutter training in Patel
Web Solution . The trainer is
really good and explained me
with many real-time examples.
The institution has very good in
infrastructure and also good for
studying. I will surely
recommend this institute if u
want to improve your personal
skills and knowledge. The
institute was very helpful in
understanding my need and
accommodating it. Thanks for
the training.
Bachelor of Computer Application (BCA) - Silver Oak university

I recently attended the Spoken
English course at Patel Web
Solution, and I had an amazing
experience! The instructors
were knowledgeable,
supportive, and helped me to
improve my English speaking
skills significantly. The course
was well-structured, and the
atmosphere was friendly and
encouraging.I highly
recommend Patel Web Solution
to anyone looking to improve
their Spoken English skills. The
institute truly delivers on its
promise, and I'm grateful for
the experience
12th Science - Pooja Vidhyalaya

I recently completed the Tally
classes and the CCC course,
and I'm thoroughly impressed
with both. The Tally classes
were incredibly detailed and
well-structured, providing a
solid foundation in accounting,
GST, and financial
management software. The
instructors were highly
knowledgeable and ensured that
all concepts were clearly
explained, making it easy to
grasp even for beginners.
BBA (HONS) - GLS University

5 I have completed Front End
Development Course. Very
knowledgeable faculty and
good facilities here from the
fundamentals to advanced
strategy every aspect was
covered in detail. I would
personally recommend to all to
join Patel Web Solution for
learning best IT courses. The
course helped me to build
confidence, Valuable
experiences and learning.
B.E (IT) - Sabar Institute of Technology for Girls

Hello, my name is Happy Patel.
I recently completed Full
Stack-Development Course at
Patel Web solution. I had the
best experience during my
training. Attending this institute
was a life-changing decision for
me. I came in unsure of my
career path, but thanks to the
mentorship and opportunities
provided by the faculty, I
gained confidence and clarity.
The networking opportunities
have been incredible, and I now
have a solid foundation for my
career. Provide personal
attention for each student was
remarkable point. So as per my
whole experience I strongly
recommend to you all to must
visit Patel Web Solution for
your development in IT
Industry.
Pursuing B.voc IT - Silver Oak University

My Name Patel Dharmik .I
learnt C language and CCC
Course here. The course
structure was well-defined and
each and every topic was deeply
covered. I also received
personalized attention from
Patel Web Solution I must
request to you all please to visit
Patel Web Solution for learning
best computer courses.
12th pass (Commerce) - Silver Oak University

Hi, I'm Arpit, and I recently
completed the PHP Web
Development course at Patel
Web Solution. The course was
well-structured, and the
teaching methods were
engaging. The instructors were
knowledgeable and supportive.
The course covered topics from
basics to advanced, including
Php particularly enjoyed the
project-based learning
approach, which helped me to
build a strong portfolio
Bachelor of Computer Application (BCA) - S.V Vanijya Mahavidhyalaya

My time at Patel Web Solution
has truly been life-changing.
The professors are not only
experts in their fields but also
genuinely care about the
success of their students. The
learning environment is
collaborative, and the campus
is vibrant with plenty of
extracurricular activities. The
institute encourages personal
growth, and I’ve made lifelong
friendships here. It’s been a
wonderful experience, and I
highly recommend this institute
to anyone looking to advance
their education and career..
B.tech in Computer Engineering - Monark University